- Home Screen
- Customer screen
- Add a new customer
- Manage customers
- Customer transactions
- Import from file
- Customer groups
- Multi-level loyalty system
- Products and services
- Definition of rewards
- Definition of subscriptions
- Definition of repeat purchases
- Stores
- Stores groups
- Stores analysis
- Preferences
- SMS and Email settings
- Set up Customer Portal
- Web/WI-FI customer registration
- Transaction history
- Statistics
- Manage bookings
- Users
- Loyalty circuits
- Multi level marketing
- Virtual Fidelity Card for IOS and Android
Statistical analysis
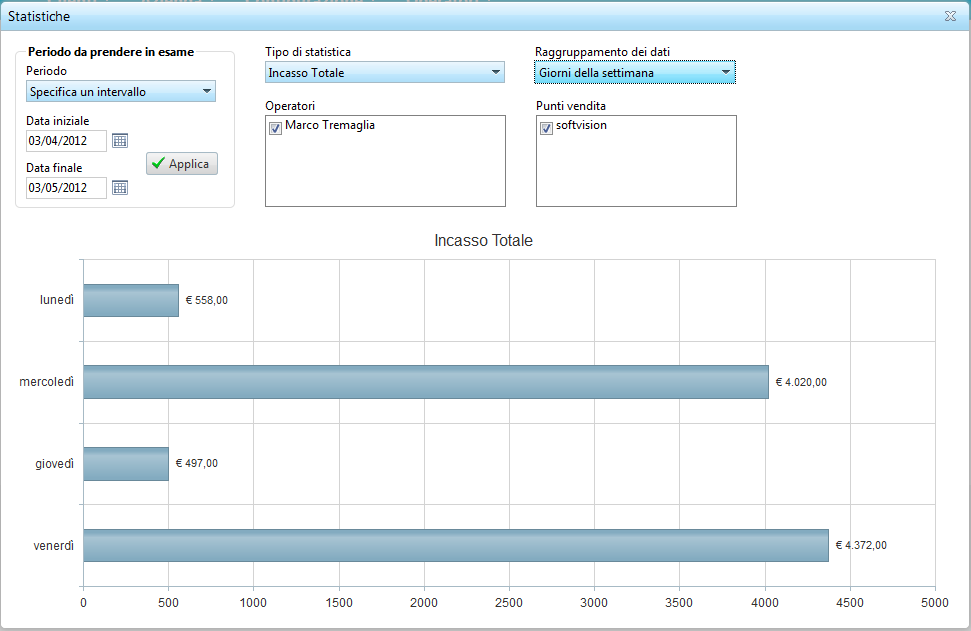
This function, in the "Company" menu allows you to perform statistical analysis on the transactions carried out in your business. The data, shown in a graph, can be filtered according to period of time, user or outlet.
The types of statistics available are: new customers, distributed points, total income, average discount, number of subscriptions, cashed subscriptions, rewards distributed, repeat purchases used, number of credit recharges and cashing of recharged credit.
The processed data can be grouped in several ways:
- Months : Data are shown for each month. For example, if you choose to analyze the number of hours of use for the past six months, it will show the total hours for each of these months.
- Months of the year : Analyzes data grouped according to the twelve months of the year.
- Days : As above, but shows the total content of each day during the period analyzed.
- Days of the Week: Analyzes the data according to the seven days of the week. In this way, for example, you can find out which days of the week see more hours of browsing.
- Hours of the Day : Same as above, but analyzes the 24 hours of the day. Useful to understand at what times the place is busiest.


